See and control every machine from one dashboard.
Prometheus is a remote administration and monitoring platform. Drop a lightweight Python agent on any node and watch it stream live metrics to your dashboard over WebSockets — then send commands right back.
git clone https://github.com/drzewkopl/Prometheus.git
Three pieces, one live loop.
Agents push system state to a central FastAPI server; the dashboard subscribes and dispatches commands. Everything travels over WebSockets, so updates land the moment they happen.
Web dashboard
A React + TypeScript frontend for overview maps, charts, consoles and alert management.
FastAPI server
REST API and WebSocket hub. Handles auth, agent registration, alert rules and command routing.
Python agents
Lightweight collectors on each node. Report metrics, run commands and stream output back.
Everything you need to keep an eye on your fleet.
From a single laptop to a scattered set of servers — monitor, compare, diagnose and act without SSH-hopping between machines.
Live system health
CPU, memory, disk, uptime, process count and latency per agent, streamed and charted in real time.
Global agent map
Agents geolocate themselves by WAN IP and appear on an interactive world map with their status.
Network topology
See agents grouped by network, with interfaces, bandwidth per NIC, open ports and active connections.
Compare agents
Put machines side by side to spot the outlier hogging resources before it becomes a problem.
Disk analyzer
Browse remote file systems, drill into directories and see what is eating space — with owner and permissions.
Command console
Dispatch commands to any agent and watch stdout/stderr stream back live. Tail remote log files too.
Alerts & rules
Define thresholds once; the alerts dashboard surfaces every breach across all connected nodes.
Network diagnostics
Run traceroutes, latency tests, Wi-Fi scans and service listings remotely, straight from the UI.
Clone agent tool
Duplicate an existing agent setup to onboard new machines quickly and consistently.
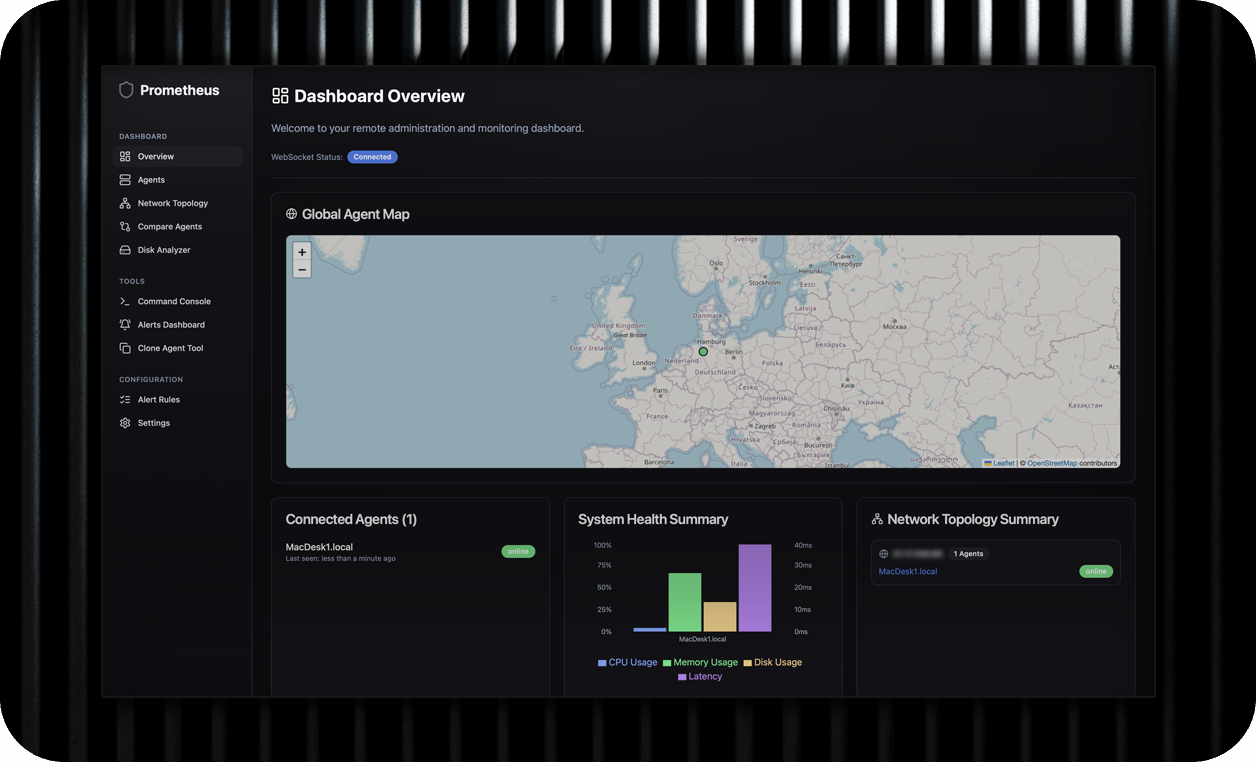
Your whole fleet at a glance.
The overview pulls together where your agents are, whether they are online, how healthy they are and which network they live on.
- Live WebSocket connection status
- Leaflet / OpenStreetMap agent map
- CPU, memory, disk and latency in one chart
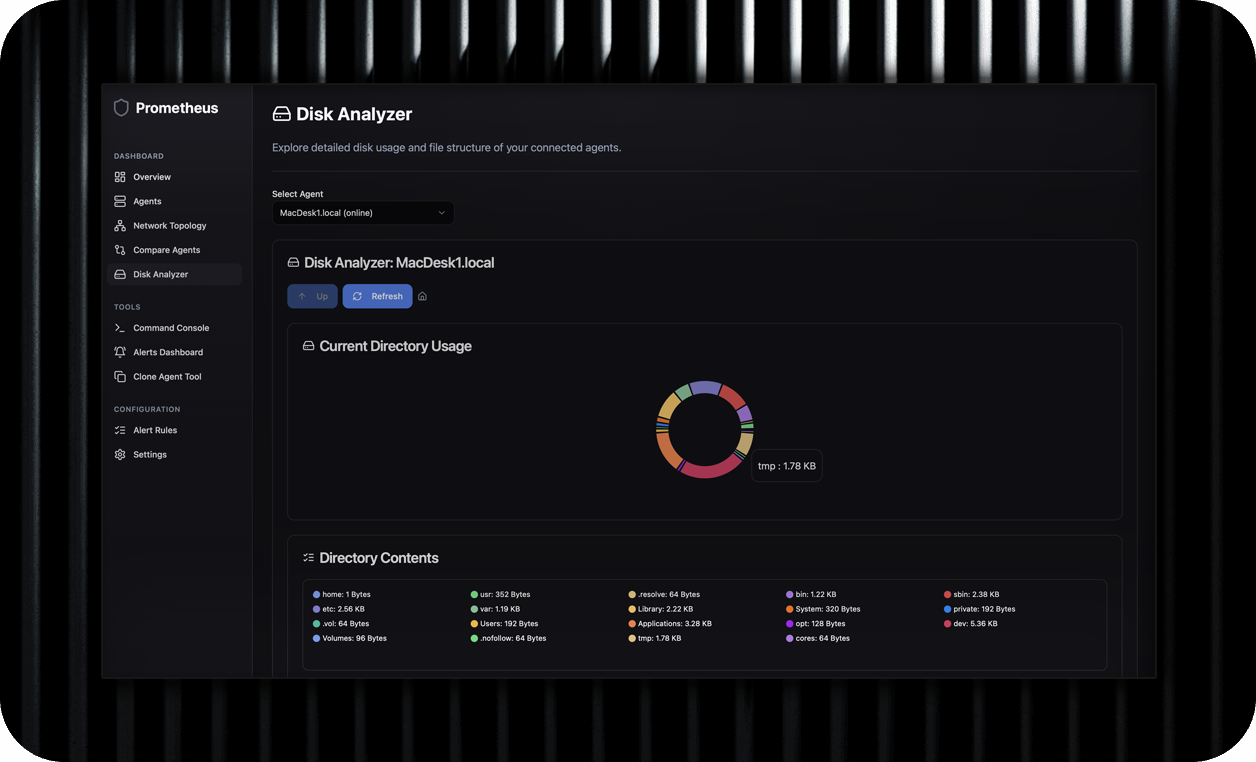
Find what is filling the disk.
Pick any online agent and explore its file system remotely. A donut chart breaks down the current directory; click through to drill deeper.
- Navigate up, refresh and jump home
- Per-entry size, type, owner and permissions
- Works on macOS, Linux and Windows agents
Up and running in minutes.
You need Node.js with npm, and Python 3.9+ with pip. Then follow the steps — or use the one-command startup.
Clone the repository and install the frontend and Python dependencies.
git clone https://github.com/drzewkopl/Prometheus.git
cd Prometheus
npm install
pip3 install -r requirements.txt
Launch the FastAPI backend. It serves the REST API and the WebSocket hub on port 8000.
export SECRET_KEY="super-secret-default-key-please-change-me"
python3 -m uvicorn server.main:app --host 0.0.0.0 --port 8000
SECRET_KEY for anything beyond local development — it signs your auth tokens.Start the frontend dev server, then open http://localhost:8080, register with email and password, and log in.
npm run devRun the agent on any machine you want to monitor and point it at your server's WebSocket endpoint. It shows up on the dashboard within seconds.
SERVER_URL="ws://localhost:8000/ws" python3 agent/agent.py
On a remote node, replace localhost with the address of the machine running the server.
Prefer a single command for local development? The startup script brings everything up for you.
sh ./startdev.shA modern, familiar stack.
Ready to light the fire?
Prometheus is free and open source under the MIT license. Star the repo, try it on your machines, and contributions are welcome.